Common issues with a vSphere with Tanzu Cluster deployment stuck in Configuring state
Article ID: 323411
Updated On:
Products
VMware vSphere ESXi
Issue/Introduction
There are many reasons why a cluster will hang in a configuring state. This kb should help in ruling out common issues with deployments and should be your first step in troubleshooting.
Also note, even when a cluster is stuck in a configuring status, you can still select the cluster from the Workload management page and export logs to give to VMware Support. If you open a case with VMware support please provide these logs asap along with a vcenter log bundle.
Symptoms:
After enabling vSphere with Tanzu, the cluster hangs in a configuring state under Menu -> Workload Management -> Clusters. Occasionally it may pop into an error state.
Environment
VMware vSphere 7.0.x
Resolution
Most common issues for a failed deployment are
1. DNS/Routing issues.
2. NTP time skew issues.
https://<vcenter_fqdn>:5480 (log in as root)
Then Check esxi time configuration here.
To check either the HAProxy time or the nsx manager time, ssh into them and run the date command to validate that time is synced.
Finally you will need to check NTP on the Supervisor control plane VM's themselves. In the below section about DNS I explain how to SSH into the SV VMs. When you on the SV VM, simple run a date command to validate the time is correct.
To troubleshoot DNS from the supervisor control plane VM's, ssh into the supervisor control plane VM via the method under "Checking DNS" then use the following to troubleshoot.
Troubleshooting ntp from a supervisor control plane VM.
Check ntp configs from /etc/systemd/timesyncd.conf
*Note: do not change this file, as next time wcp service does a resync, it will rewrite the file with its desired state located on the VCDB
**DoubleNote: In newer builds, the ntp config has moved to /etc/systemd/network/10-eth0.network
Use timedatectl to check ntp connections.
root@422a835978d79ec2db9db501f35a14fc [ /var/log ]# timedatectl show
Timezone=UTC
LocalRTC=no
CanNTP=yes
NTP=yes
NTPSynchronized=yes
TimeUSec=Tue 2021-07-06 17:56:20 UTC
RTCTimeUSec=Tue 2021-07-06 17:56:20 UTC
root@422a835978d79ec2db9db501f35a14fc [ /var/log ]# timedatectl status
Local time: Tue 2021-07-06 17:56:29 UTC
Universal time: Tue 2021-07-06 17:56:29 UTC
RTC time: Tue 2021-07-06 17:56:30
Time zone: UTC (UTC, +0000)
System clock synchronized: yes
NTP service: active
RTC in local TZ: no
root@422a835978d79ec2db9db501f35a14fc [ /var/log ]# timedatectl timesync-status
Server: 192.168.100.1 (192.168.100.1)
Poll interval: 2min 8s (min: 32s; max 34min 8s)
Leap: normal
Version: 4
Stratum: 4
Reference: A10BCD2
Precision: 1us (-23)
Root distance: 141.120ms (max: 5s)
Offset: +226us
Delay: 800us
Jitter: 85us
Packet count: 2
Frequency: +85.428ppm
root@422a835978d79ec2db9db501f35a14fc [ /var/log ]# timedatectl show-timesync
SystemNTPServers=192.168.100.1
FallbackNTPServers=0.vmware.pool.ntp.org 1.vmware.pool.ntp.org 2.vmware.pool.ntp.org 3.vmware.pool.ntp.org
ServerName=192.168.100.1
ServerAddress=192.168.100.1
RootDistanceMaxUSec=5s
PollIntervalMinUSec=32s
PollIntervalMaxUSec=34min 8s
PollIntervalUSec=2min 8s
NTPMessage={ Leap=0, Version=4, Mode=4, Stratum=4, Precision=-23, RootDelay=66.818ms, RootDispersion=107.711ms, Reference=A10BCD2, OriginateTimestamp=Tue 2021-07-06 17:56:03 UTC, ReceiveTimestamp=Tue 2021-07-06 17:56:03 UTC, TransmitTimestamp=Tue 2021-07-06 17:56:03 UTC, DestinationTimestamp=Tue 2021-07-06 17:56:03 UTC, Ignored=no PacketCount=2, Jitter=85us }
Frequency=5598579
root@422a835978d79ec2db9db501f35a14fc [ /var/log ]#
Increase logging to debug
To view the logs run...
To remove the debug logging...
The kube-apiserver logs will show the following error if the Supervisor Control Plane VM is not able to resolve vCenter's DNS:
E0627 10:42:16.111028 1 oidc.go:524] oidc authenticator: initializing plugin: Get "https://<vCenter_FQDN>/openidconnect/vsphere.local/.well-known/openid-configuration": dial tcp: lookup <vCenter_FQDN> on 127.0.0.53:53: server misbehaving
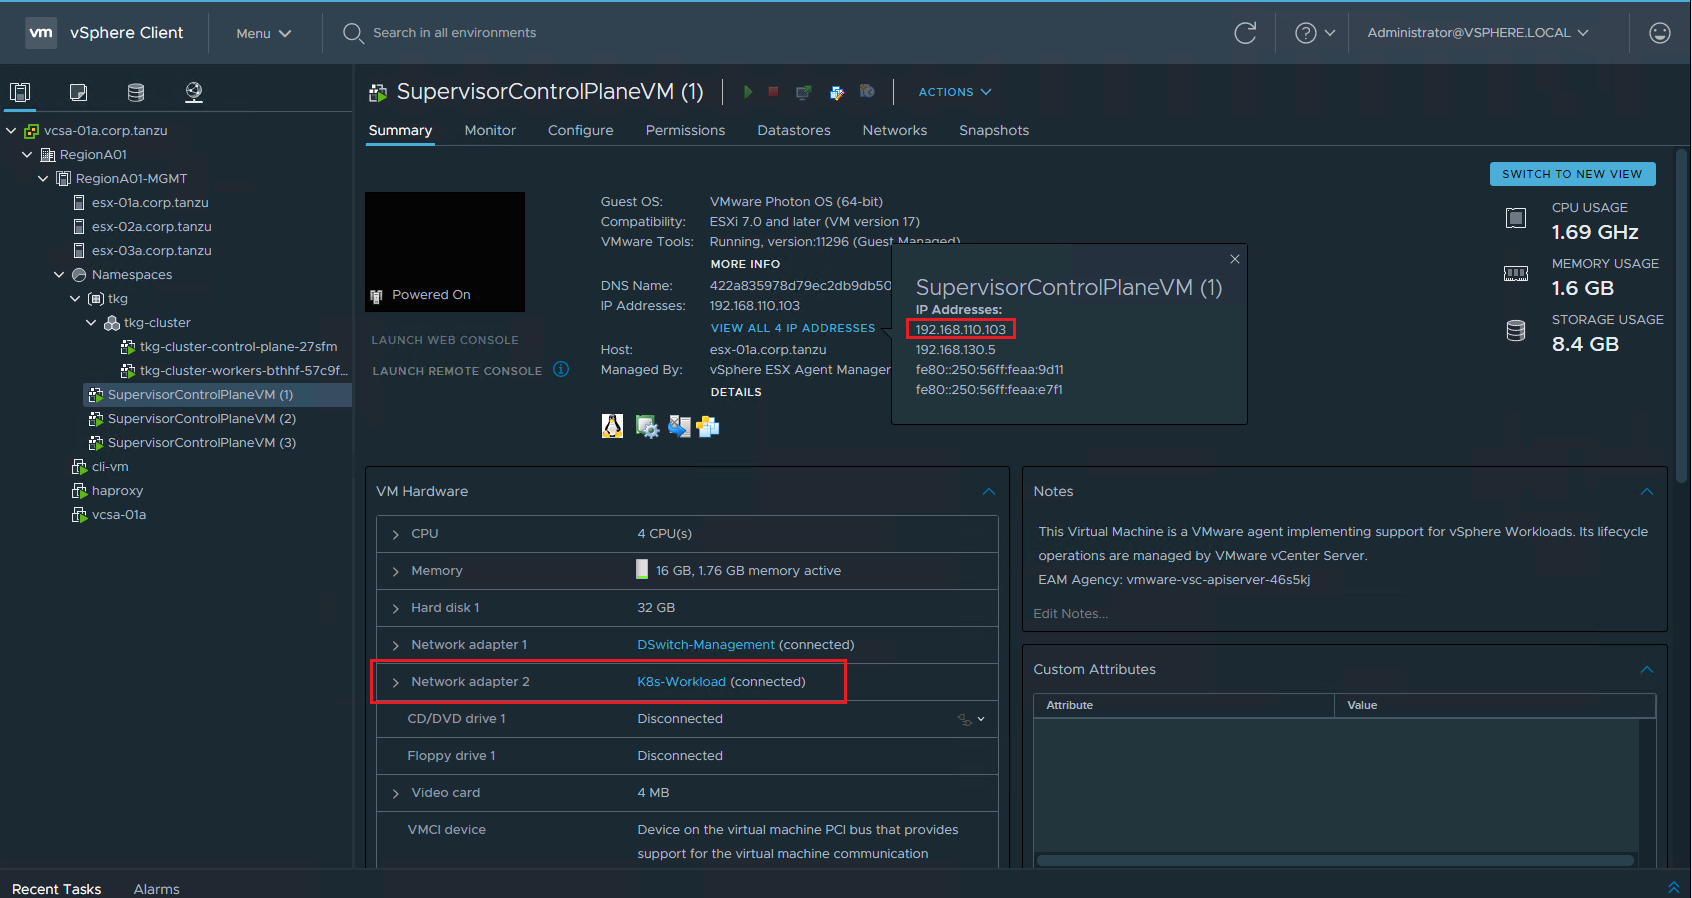
You will want to test DNS from a supervisor control plane VM that has 2 nics, so check the summary page for the Supervisor VM's validate which one has two nics and also note the VM's management ip address.
Next follow the steps in KB 90194 to ssh into the supervisor control plane VM.
Once you are in the SV VM run an nslookup against your vCenter to validate that it can resolve it.
If it fails, then test network connectivity between eth1 and the dns server. In the example below my DNS server is 192.168.110.10.
1. DNS/Routing issues.
2. NTP time skew issues.
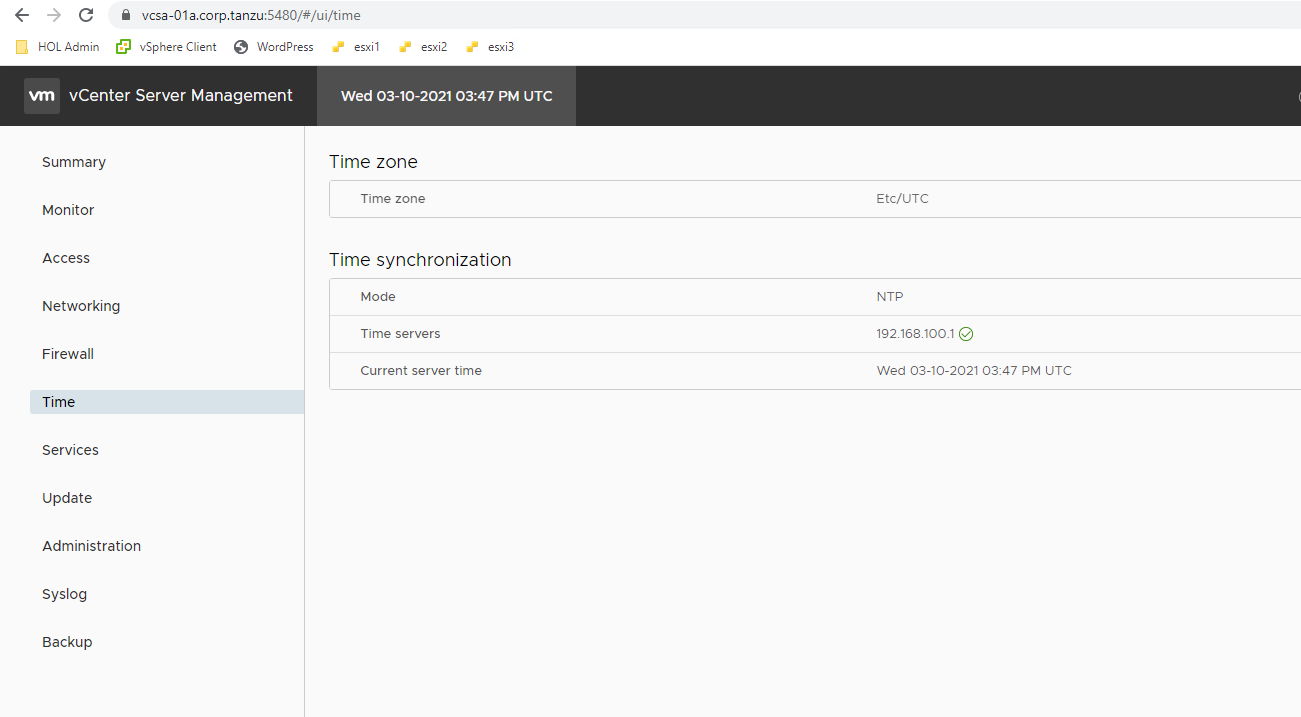
Checking NTP
Checking NTP is quick and painless and should be your first step. You will need to check vCenter time from the vamihttps://<vcenter_fqdn>:5480 (log in as root)
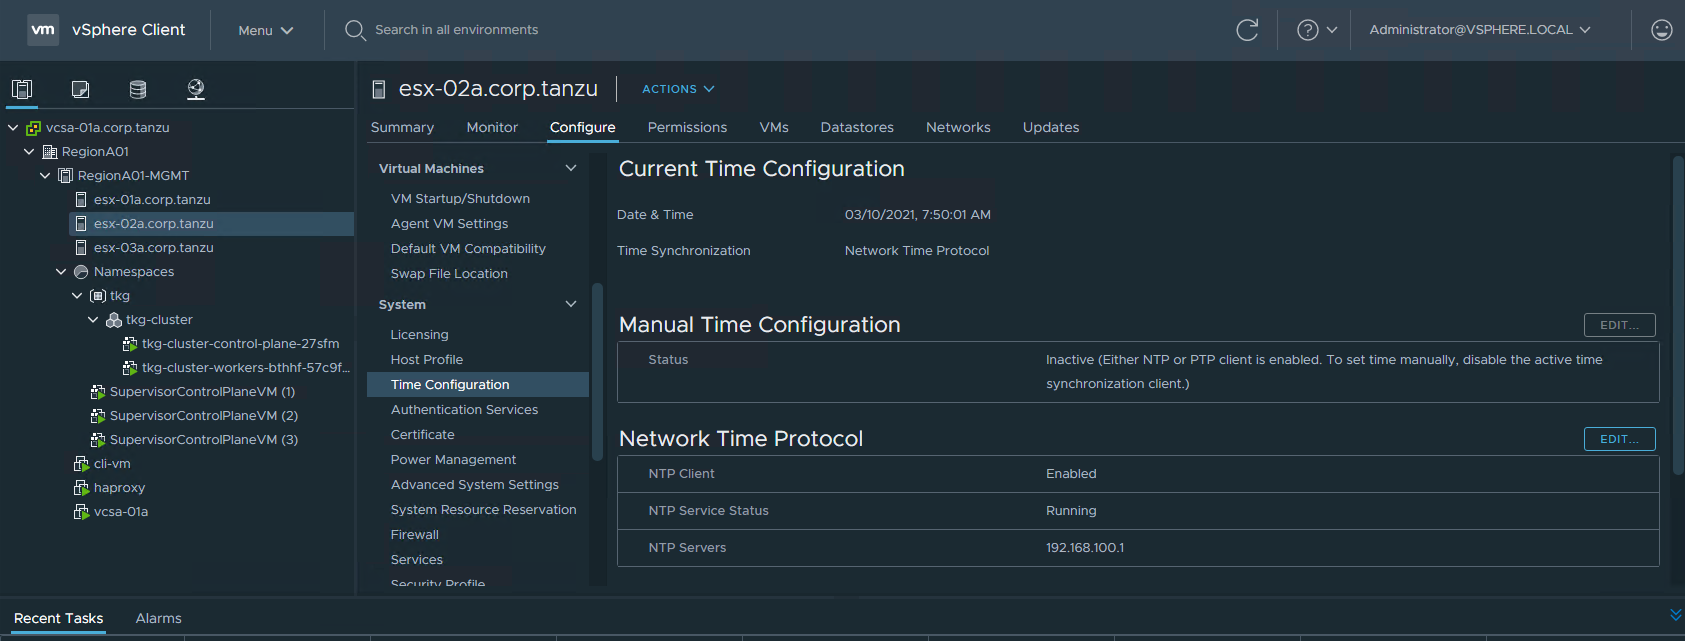
Then Check esxi time configuration here.
To check either the HAProxy time or the nsx manager time, ssh into them and run the date command to validate that time is synced.
Finally you will need to check NTP on the Supervisor control plane VM's themselves. In the below section about DNS I explain how to SSH into the SV VMs. When you on the SV VM, simple run a date command to validate the time is correct.
To troubleshoot DNS from the supervisor control plane VM's, ssh into the supervisor control plane VM via the method under "Checking DNS" then use the following to troubleshoot.
Troubleshooting ntp from a supervisor control plane VM.
Check ntp configs from /etc/systemd/timesyncd.conf
*Note: do not change this file, as next time wcp service does a resync, it will rewrite the file with its desired state located on the VCDB
**DoubleNote: In newer builds, the ntp config has moved to /etc/systemd/network/10-eth0.network
root@422a835978d79ec2db9db501f35a14fc [ /var/log ]# cat /etc/systemd/timesyncd.conf
# This file is part of systemd.
#
# systemd is free software; you can redistribute it and/or modify it
# under the terms of the GNU Lesser General Public License as published by
# the Free Software Foundation; either version 2.1 of the License, or
# (at your option) any later version.
#
# Entries in this file show the compile time defaults.
# You can change settings by editing this file.
# Defaults can be restored by simply deleting this file.
#
# See timesyncd.conf(5) for details.
[Time]
#NTP=
#RootDistanceMaxSec=5
#PollIntervalMinSec=32
#PollIntervalMaxSec=2048
FallbackNTP=0.vmware.pool.ntp.org 1.vmware.pool.ntp.org 2.vmware.pool.ntp.org 3.vmware.pool.ntp.org
NTP=192.168.100.1
root@422a835978d79ec2db9db501f35a14fc [ /var/log ]#
Use timedatectl to check ntp connections.
timedatectl show
timedatectl status
timedatectl timesync-status
timedatectl show-timesync
timedatectl status
timedatectl timesync-status
timedatectl show-timesync
root@422a835978d79ec2db9db501f35a14fc [ /var/log ]# timedatectl show
Timezone=UTC
LocalRTC=no
CanNTP=yes
NTP=yes
NTPSynchronized=yes
TimeUSec=Tue 2021-07-06 17:56:20 UTC
RTCTimeUSec=Tue 2021-07-06 17:56:20 UTC
root@422a835978d79ec2db9db501f35a14fc [ /var/log ]# timedatectl status
Local time: Tue 2021-07-06 17:56:29 UTC
Universal time: Tue 2021-07-06 17:56:29 UTC
RTC time: Tue 2021-07-06 17:56:30
Time zone: UTC (UTC, +0000)
System clock synchronized: yes
NTP service: active
RTC in local TZ: no
root@422a835978d79ec2db9db501f35a14fc [ /var/log ]# timedatectl timesync-status
Server: 192.168.100.1 (192.168.100.1)
Poll interval: 2min 8s (min: 32s; max 34min 8s)
Leap: normal
Version: 4
Stratum: 4
Reference: A10BCD2
Precision: 1us (-23)
Root distance: 141.120ms (max: 5s)
Offset: +226us
Delay: 800us
Jitter: 85us
Packet count: 2
Frequency: +85.428ppm
root@422a835978d79ec2db9db501f35a14fc [ /var/log ]# timedatectl show-timesync
SystemNTPServers=192.168.100.1
FallbackNTPServers=0.vmware.pool.ntp.org 1.vmware.pool.ntp.org 2.vmware.pool.ntp.org 3.vmware.pool.ntp.org
ServerName=192.168.100.1
ServerAddress=192.168.100.1
RootDistanceMaxUSec=5s
PollIntervalMinUSec=32s
PollIntervalMaxUSec=34min 8s
PollIntervalUSec=2min 8s
NTPMessage={ Leap=0, Version=4, Mode=4, Stratum=4, Precision=-23, RootDelay=66.818ms, RootDispersion=107.711ms, Reference=A10BCD2, OriginateTimestamp=Tue 2021-07-06 17:56:03 UTC, ReceiveTimestamp=Tue 2021-07-06 17:56:03 UTC, TransmitTimestamp=Tue 2021-07-06 17:56:03 UTC, DestinationTimestamp=Tue 2021-07-06 17:56:03 UTC, Ignored=no PacketCount=2, Jitter=85us }
Frequency=5598579
root@422a835978d79ec2db9db501f35a14fc [ /var/log ]#
Increase logging to debug
root@422a835978d79ec2db9db501f35a14fc [ /var/log ]# mkdir -p /etc/systemd/system/systemd-timesyncd.service.d/
root@422a835978d79ec2db9db501f35a14fc [ /var/log ]# printf "[Service]\nEnvironment=SYSTEMD_LOG_LEVEL=debug\n" > /etc/systemd/system/systemd-timesyncd.service.d/10-logging.conf
root@422a835978d79ec2db9db501f35a14fc [ /var/log ]# systemctl daemon-reload
root@422a835978d79ec2db9db501f35a14fc [ /var/log ]# systemctl restart systemd-timesyncd.service
To view the logs run...
root@422a835978d79ec2db9db501f35a14fc [ /var/log ]# journalctl -u systemd-timesyncd
To remove the debug logging...
root@422a835978d79ec2db9db501f35a14fc [ /var/log ]# rm /etc/systemd/system/systemd-timesyncd.service.d/10-logging.conf
root@422a835978d79ec2db9db501f35a14fc [ /var/log ]# systemctl daemon-reload
root@422a835978d79ec2db9db501f35a14fc [ /var/log ]# systemctl restart systemd-timesyncd.service
root@422a835978d79ec2db9db501f35a14fc [ /var/log ]# systemctl daemon-reload
root@422a835978d79ec2db9db501f35a14fc [ /var/log ]# systemctl restart systemd-timesyncd.service
Checking DNS
Whenever you configure your management DNS the same as your Workload DNS, the Supervisor Control Plane VMs(SV VMs) will choose to route to the DNS from the workload nic on the supervisor control plane VM.The kube-apiserver logs will show the following error if the Supervisor Control Plane VM is not able to resolve vCenter's DNS:
E0627 10:42:16.111028 1 oidc.go:524] oidc authenticator: initializing plugin: Get "https://<vCenter_FQDN>/openidconnect/vsphere.local/.well-known/openid-configuration": dial tcp: lookup <vCenter_FQDN> on 127.0.0.53:53: server misbehaving
You will want to test DNS from a supervisor control plane VM that has 2 nics, so check the summary page for the Supervisor VM's validate which one has two nics and also note the VM's management ip address.
Next follow the steps in KB 90194 to ssh into the supervisor control plane VM.
PLEASE NOTE: When on the supervisor control plane VM you have permissions to permanently damage the cluster. If VMware Support finds evidence of a customer making changes to the supervisor cluster from the SV VM, they may mark your cluster as unsupported and require you redeploy the entire vSphere with Tanzu solution. Only use this session to test networks, look at logs, and run kubectl logs/get/describe commands. Do not deploy, delete, or edit anything from this session.
Once you are in the SV VM run an nslookup against your vCenter to validate that it can resolve it.
root@422a835978d79ec2db9db501f35a14fc [ ~ ]# nslookup vcsa-01a.corp.tanzu
Server:         127.0.0.53
Address:        127.0.0.53#53

Non-authoritative answer:
Name:   vcsa-01a.corp.tanzu
Address: 192.168.110.22

root@422a835978d79ec2db9db501f35a14fc [ ~ ]#
If it fails, then test network connectivity between eth1 and the dns server. In the example below my DNS server is 192.168.110.10.
root@422a835978d79ec2db9db501f35a14fc [ ~ ]# ping -I eth1 192.168.110.10
PING 192.168.110.10 (192.168.110.10) from 192.168.130.5 eth1: 56(84) bytes of data.
64 bytes from 192.168.110.10: icmp_seq=1 ttl=127 time=1.56 ms
64 bytes from 192.168.110.10: icmp_seq=2 ttl=127 time=4.17 ms
64 bytes from 192.168.110.10: icmp_seq=3 ttl=127 time=3.52 ms
^C
--- 192.168.110.10 ping statistics ---
3 packets transmitted, 3 received, 0% packet loss, time 5ms
rtt min/avg/max/mdev = 1.559/3.083/4.168/1.111 ms
root@422a835978d79ec2db9db501f35a14fc [ ~ ]#
If this fails, you can use traceroute, curl, and tcpdump in conjunction with your networking team in order to troubleshoot where in your networking stack the ping is failing.
Feedback
Yes
No
Powered by
