vSAN health Performance data collection fails
Article ID: 326464
Updated On:
Products
VMware vSAN
Issue/Introduction
This article explains troubleshooting steps for when the vSAN Performance Graphs are not visible in vCenter.
Symptoms:
Symptoms:
In the vSAN Health plugin the vSAN Performance data collection test fails
Details:
- stats gathering failed
- stats persistence failed
Cause
There are a few common causes:
- Performance service not enabled.
- The ESXi hosts are on a newer version than vCenter.
- Host certs are invalid/expired
- Failed/stopped services.
- The “Turn ON Virtual SAN performance service” is not enabled for VM policies.
- Port 80 used for Performance Services is blocked on the ESXi hosts, see VMware Ports and Protocols for required vSAN ports
Resolution
To get vSAN performance graphs/charts, first, you need to enable the vSAN performance service.
Before you configure the vSAN Performance Service, make sure that the cluster is properly configured and has no unresolved health problems.
Configure vSAN Performance Service
Example:
After the service starts/restarts, go back to the vCenter web Client and click the “Edit” button for the Performance Service box

Workaround:
1) Restarting the vsanmgmtd service on all the ESXi hosts in the vSAN Cluster. There is no impact of restarting this service on the ESXi hosts,
2) Re-enable the performance service from the cluster level
4) Check firewalls and make sure port 80 is not being blocked
5) If the first 4 options don't resolve the issue collect entire cluster logs, open a case with vSAN support, and upload the logs for further investigation.
Before you configure the vSAN Performance Service, make sure that the cluster is properly configured and has no unresolved health problems.
Configure vSAN Performance Service
Example:
After the service starts/restarts, go back to the vCenter web Client and click the “Edit” button for the Performance Service box
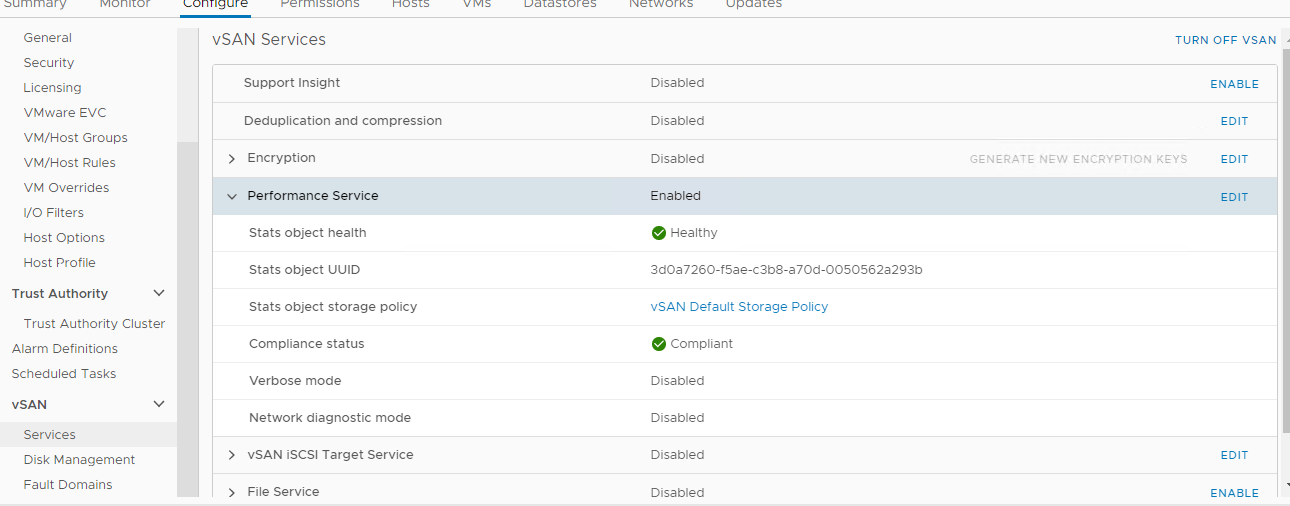
- Select the appropriate storage policy from the dropdown, ensure the “Turn ON Virtual SAN performance service” box is checked, and click “OK”
- Confirm that the performance service is turned on and reporting healthy
- Ensure all VMs are compliant with the related VM Storage policy.
- Reapply storage policy to VMs if necessary.
- Run the performance health check test again.
Workaround:
1) Restarting the vsanmgmtd service on all the ESXi hosts in the vSAN Cluster. There is no impact of restarting this service on the ESXi hosts,
- /etc/init.d/vsanmgmtd restart
- /etc/init.d/vsanmgmtd status
2) Re-enable the performance service from the cluster level
- Go to vSAN Cluster > Configure > vSAN > Services
- Click “Turn off” in the “Performance Service”
- Ensure that the Performance Service is disabled by refreshing the page.
- Re-enable the Performance Service and retest the Skyline Health.
4) Check firewalls and make sure port 80 is not being blocked
5) If the first 4 options don't resolve the issue collect entire cluster logs, open a case with vSAN support, and upload the logs for further investigation.
Additional Information
Impact/Risks:
You can view performance changes from different levels of entities (clusters, hosts, disk groups, physical disks, virtual machines and virtual disks) and different standpoints (Virtual Machine consumption, vSAN backend).
There are multiple graphs you can monitor to understand vSAN performance. To review the details of all available vSAN performance graphs, see vSAN Performance Graphs in the vSphere Web Client Part 1 (2144493)
It appears that vSAN Performance has stopped collecting data.
Feedback
Yes
No
Powered by
