/storage/seat disk 100% full on vCenter Server Appliance 6.x/7.x
Article ID: 318931
Updated On:
Products
VMware vCenter Server
Issue/Introduction
Symptoms:
- The vCenter Server Appliance services fail to start.
- When connecting to the VCSA using the vSphere Web Client, you see the error similar to:
503 Service Unavailable
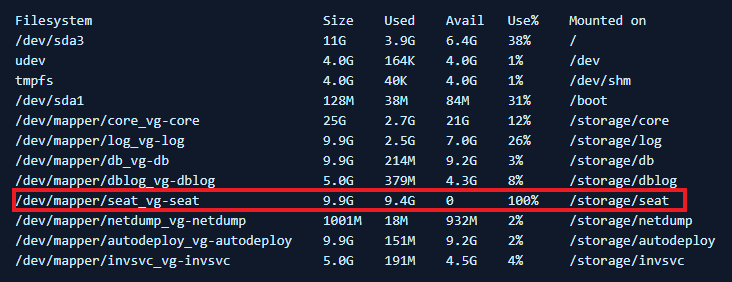
- Running df -h on the vCenter Server Appliance shows the /dev/mapper/seat_vg-seat mounted on /storage/seat as 95% or more full.
- In the /var/log/vmware/vpxd/vpxd.log file, see entries similar to:
- In the /var/log/vmware/vpxd.log file of the vCenter Server Appliance 6.7.x, you see entries similar to:
- In the /var/log/vmware/vpxd.log file of the vCenter Server 7.x, you see entries similar to:
Environment
VMware vCenter Server Appliance 6.7.x
VMware vCenter Server Appliance 6.0.x
VMware vCenter Server Appliance 6.5.x
VMware vCenter Server 7.0.x
VMware vCenter Server Appliance 6.0.x
VMware vCenter Server Appliance 6.5.x
VMware vCenter Server 7.0.x
Cause
This issue occurs due to a large amount of events collected on the vCenter Server Appliance filling the database. By default, when the space is 95% or more full the critical vmware-vpxd service will not be allowed to run to prevent the database from becoming corrupted.
The most frequent cause of this happening is Excessive Hardware health alarms being triggered for "Sensor -1 type" on ESXi hosts running vSphere 6.7 U3.
The most frequent cause of this happening is Excessive Hardware health alarms being triggered for "Sensor -1 type" on ESXi hosts running vSphere 6.7 U3.
Resolution
To resolve this issue, you need to find which ESXi host is causing the events table to be filled. After this is done, the events tables must be truncated.
To find the ESXi host that is generating the events:
Note: If you are logged in as Root user, "su -c" is not required.
To find the ESXi host that is generating the events:
- Take a backup of the VCDB, see Back up and restore vCenter Server Appliance/vCenter Server 6.x vPostgres database
- Take a snapshot of the vCenter Server Appliance.
- Connect to vCenter Server Appliance through the console or using an SSH session and root credentials.
- Enable the shell by running this command:
shell.set --enabled true
- Type shell and press Enter.
- Stop the vpxd service by running: service-control --stop vmware-vpxd
- Run this command to log in to the vCenter Server Appliance database:
/opt/vmware/vpostgres/current/bin/psql -d VCDB -U postgres
- Run this query to determine the source of the events:
vCenter Server Appliance 6.0 :-
SELECT COUNT(EVENT_ID) AS NUMEVENTS, EVENT_TYPE, USERNAME FROM VPX_EVENT GROUP BY EVENT_TYPE, USERNAME ORDER BY NUMEVENTS DESC LIMIT 10;
vCenter Server Appliance 6.5/6.7/7.0:
SELECT COUNT(EVENT_ID) AS NUMEVENTS, EVENT_TYPE, USERNAME FROM VPXV_EVENT_ALL GROUP BY EVENT_TYPE, USERNAME ORDER BY NUMEVENTS DESC LIMIT 10;
You see output similar to:
vmfs.heartbeat.timedout |192.168.50.71 | 12191576
vim.event.UserLogoutSessionEvent |192.168.50.71 | 1219121
vim.event.VmAcquiredTicketEvent |192.168.50.71 | 15568
vim.event.UserLogoutSessionEvent |192.168.50.71 | 1219121
vim.event.VmAcquiredTicketEvent |192.168.50.71 | 15568
- To reclaim space, run this command from the shell:
su -c "/opt/vmware/vpostgres/current/bin/vacuumdb -d VCDB -e -v -f -U postgres > /tmp/vacuumdb.log"
Note: If you are logged in as Root user, "su -c" is not required.
- In the above example we see 12191576 events generated from the ESXi host with the IP of 192.168.50.71 related to: vmfs.heartbeat.timedout.
- This host must be further investigated to resolve the issue that is being reported.
To clean up the events in the vCenter Server Appliance database, take a snapshot of the VCSA VM, then do the follow
- From the console or SSH session connected to vCenter Server Appliance, run these commands to truncate the event table data:
vCenter Server Appliance 6.0:
truncate table vpx_event cascade;
and:
truncate table vpx_event_arg cascade;
vCenter Server Appliance 6.5/6.7/7.0:
VCDB# SELECT nspname || '.' || relname AS "relation", pg_size_pretty(pg_total_relation_size(C.oid)) AS "total_size" FROM pg_class C LEFT JOIN pg_namespace N ON (N.oid = C.relnamespace) WHERE nspname NOT IN ('pg_catalog', 'information_schema') AND C.relkind <> 'i' AND nspname !~ '^pg_toast' ORDER BY pg_total_relation_size(C.oid) DESC LIMIT 20;
This will display the top 20 largest tables within the vCenter Server database. Truncate large tables individually.
For example:
VCDB=# truncate table vc.vpx_event_1 cascade;
Note: The Solution on this KB is truncating only vc.vpx_event_x tables.
- Exit the vCenter Server Appliance database by running this command: \q
- Start the vpxd service by running the command: service-control --start vmware-vpxd
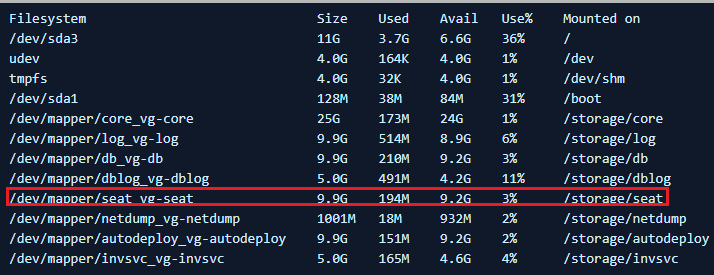
- Verify the space is reclaimed by running the df -h command.
You see output similar to:
Additional Information
VMware Skyline Health Diagnostics for vSphere - FAQ
Excessive Hardware health alarms being triggered for "Sensor -1 type" on ESXi hosts running vSphere 6.7 U3
/storage/seat ディスク使用率 100% が原因で vCenter Server Appliance 6.0 サービスが失敗する
vCenter Server Appliance 6.0 服务因 /storage/seat 磁盘耗尽而失败
Increasing the disk space for the VMware vCenter Server Appliance in vSphere 6.0
Feedback
Yes
No
Powered by
